Daily LA/LB port snapshot for November 12, 2026. Avg berth wait 0 days. Chassis: 32% of line/type combos closed for empty returns. 16.0% of empties dwelling 13+ days. Estimated $248/truck/day system impact. Empty return restrictions, terminal appointment rates, and what to watch today.
Daily LA/LB port snapshot for November 9, 2026. Avg berth wait 0 days. Chassis: 9% of line/type combos closed for empty returns. 12.7% of empties dwelling 13+ days. Estimated $198/truck/day system impact. Empty return restrictions, terminal appointment rates, and what to watch today.
Daily LA/LB port snapshot for November 6, 2026. Avg berth wait 0 days. Chassis: 18% of line/type combos closed for empty returns. 16.9% of empties dwelling 13+ days. Estimated $216/truck/day system impact. Empty return restrictions, terminal appointment rates, and what to watch today.
Port Brief: Los Angeles / Long Beach — November 12, 2026 🔴
Daily LA/LB port snapshot for November 12, 2026. Avg berth wait 0 days. Chassis: 32% of line/type combos closed for empty returns. 16.0% of empties dwelling 13+ days. Estimated $248/truck/day system impact. Empty return restrictions, terminal appointment rates, and what to watch today.
Good morning. Here's your daily drayage intelligence for the Port of Los Angeles / Long Beach complex — pulled automatically from live terminal data every day at 6 AM Pacific.
Key Numbers — LA/Long Beach, November 12, 2026
Overall status: Red — Disruption Alert
Average truck turn time: 74 min at Port of Los Angeles, 64 min at Port of Long Beach
Appointment success rate: 54%
Weekly imports: 140,726 TEU (-52.5% year over year)
Average wait for a berth: 0 days
Empty return line/type combinations closed: 32%
Empties dwelling 13+ days: 16.0%
Estimated cost impact: $248 per truck per day
Port Pulse Index — November 12, 2026
The Port Pulse Index aggregates five operational signals into a single at-a-glance status. 🔴 Overall status today: Red — Disruption Alert.
Indicator
Status
Summary
Terminal Flow
🟡 YELLOW
Avg turn time 74 min (POLA). 64 min (POLB). Appointment success rate 54%.
32% of line/type combos closed for empty returns. 16.0% of empties dwelling 13+ days.
Road Access
🟢 GREEN
Avg terminal queue 10 min. Commerce→Long Beach 26 min. Commerce→San Pedro 32 min.
Cost Pressure
🟡 YELLOW
Estimated $248/truck/day system impact.
Vessel Congestion & Volume — 🔴 RED
🔴 Volume Balance is RED. Week TEU: 140,726. WoW: -22.3%. YoY: -52.5%. Avg wait for berth 0 days.
Weekly import volume: 140,726 TEU — WoW: -22.3%, YoY: -52.5%.
Berth wait: 0 days on average (30-day rolling). 12 vessels at berth, 13 inbound to LA. Vessels are berthing without a queue.
Appointment Success Rates by Terminal
Terminal
Success Rate
APMT
77%
Trapac
63%
YTI
48%
Everport
46%
WBCT
45%
FMS
44%
Source: Port Optimizer — as of today's snapshot.
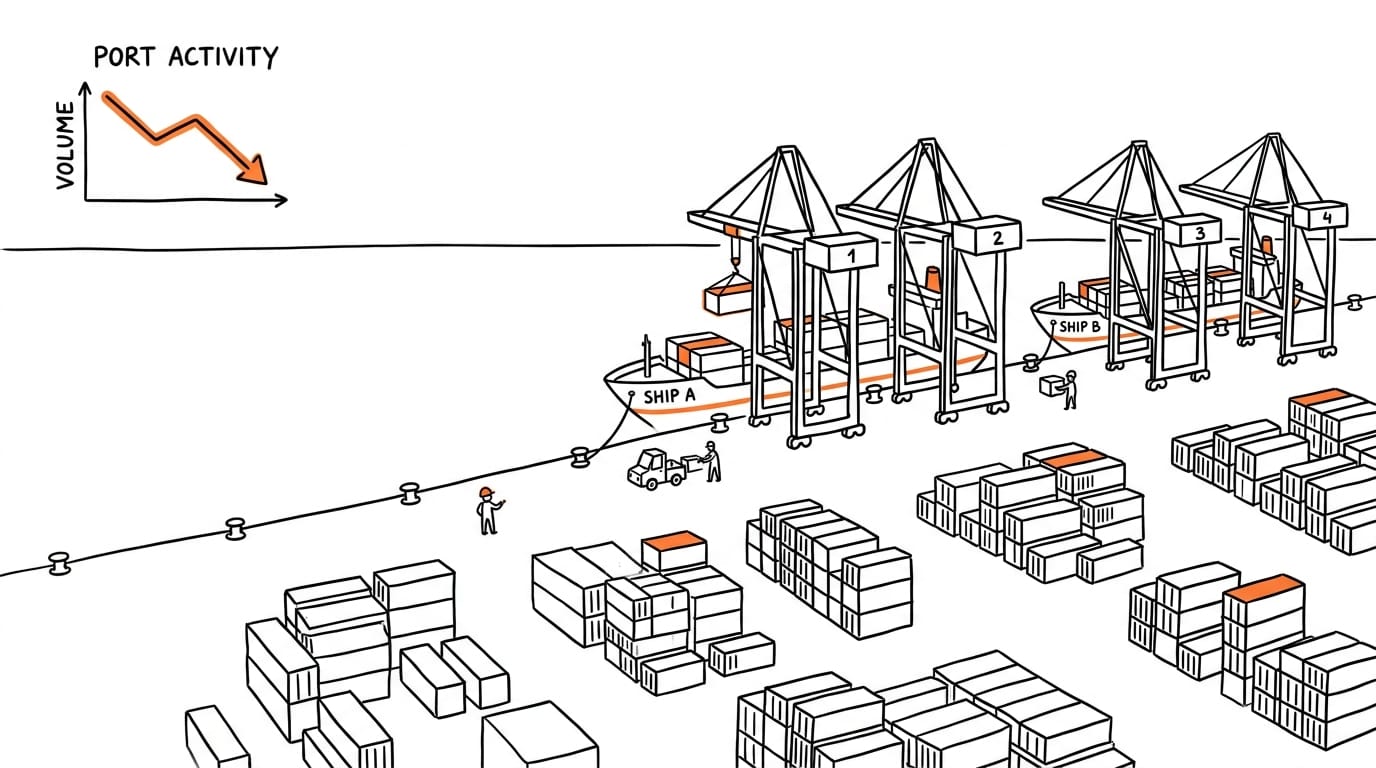
Vessel queue and import volume — November 12, 2026
Chassis Supply — 🟡 YELLOW
62% of carrier/type combinations are restricted or closed at TraPac LA for today's Shift 1. Full open: ZIM. Restricted: HMM, ONE, YML.
Carrier
20' Dry
40' Dry 86"
40' Dry 96"
45' Dry
20' Reefer
40' Reefer
Open Top
Flat Rack
HMM HYUNDAI MERCHANT MARINE
✗ Closed
✗ Closed
✗ Closed
✗ Closed
✗ Closed
✗ Closed
✗ Closed
✗ Closed
ONE OCEAN NETWORK EXPRESS
✓ Open
✓ Open
✓ Open
⇄ Dual
✗ Closed
✗ Closed
✗ Closed
✗ Closed
YML YANG MING MARINE INC
✗ Closed
✗ Closed
✗ Closed
✗ Closed
✗ Closed
✗ Closed
✗ Closed
✗ Closed
ZIM ZIM INTEGRATED SHIPPING SERVICES
✓ Open
✓ Open
✓ Open
✓ Open
✓ Open
✓ Open
✓ Open
✓ Open
Data source: TraPac LA — Shift 1 as of November 12, 2026. Dual Transaction = empty accepted only when paired with a load move.
TraPac LA empty return restrictions — November 12, 2026
Export Cutoffs — ITS Long Beach
No vessel cutoff schedule currently available from ITS Long Beach. Check itslb.com directly for active cutoffs before dispatching.
Cost Pressure — 🟡 YELLOW
🟡 Cost Pressure is currently YELLOW. Estimated $248/truck/day system impact.
Estimated daily impact: $248.43/truck. Chassis restriction rate: 32% of combos closed. Cost pressure is derived from turn times, chassis availability, and empty dwell — a composite signal for drayage economics today.
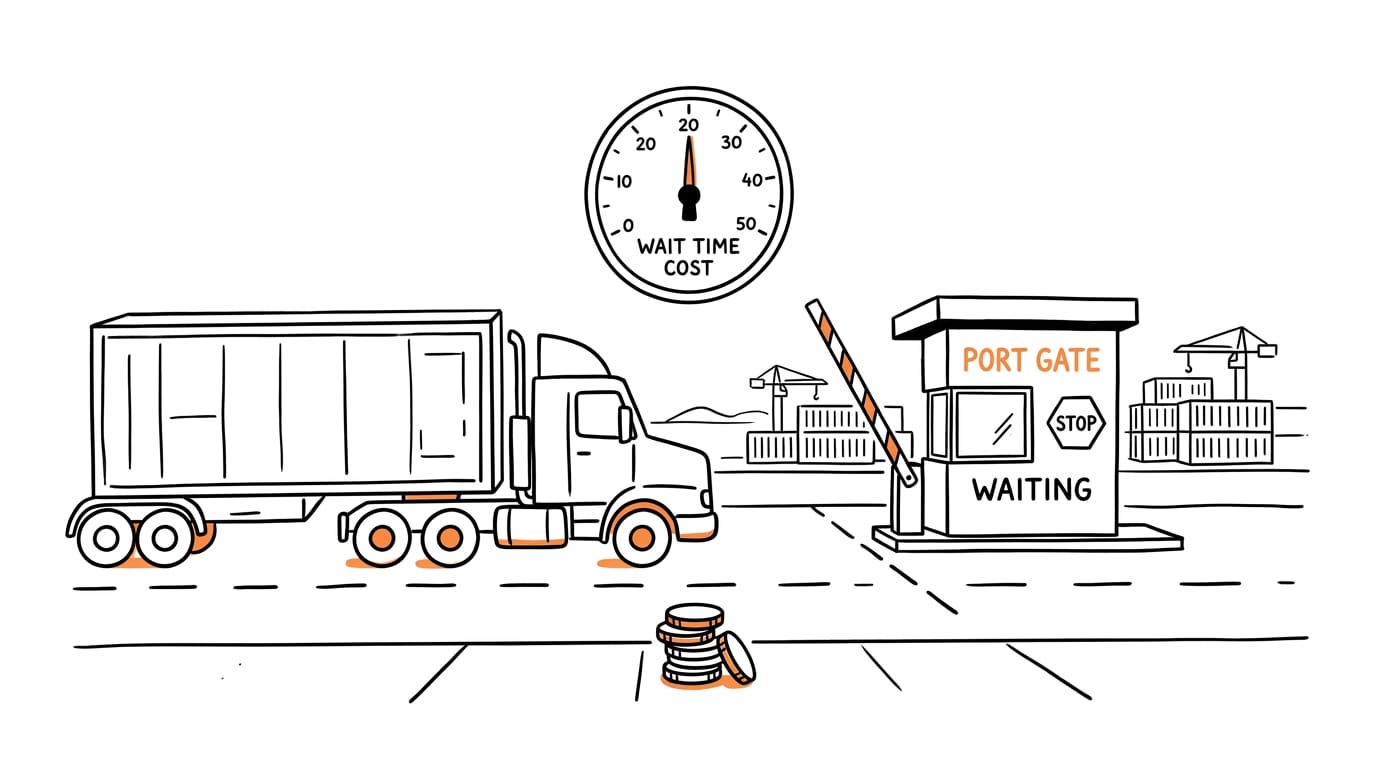
Estimated daily cost impact per truck — November 12, 2026
Road & Traffic Conditions — 🟢 GREEN
🟢 Road Access is GREEN. Avg terminal queue 10 min. Commerce→Long Beach 26 min. Commerce→San Pedro 32 min.
Route
Est. Travel Time
Avg terminal queue
10 min
Commerce → Long Beach
26 min
Commerce → San Pedro
32 min
Travel times estimated from queue data — live traffic feed not yet integrated.
What to Watch
Road conditions GREEN — Commerce→LB: 26 min, Commerce→SP: 32 min. Plan dispatch timing accordingly.
Chassis supply at YELLOW — 32% of TraPac combos restricted. Dual transactions may ease returns for HMM/ONE; plan ahead for YML freight.
Dray Insight publishes daily intelligence for drayage carriers, brokers, and importers operating in the LA/LB port complex. Data is pulled automatically each morning from public terminal sources and normalized into actionable indicators. No paywalls, no noise — just the numbers you need before the gate opens.
Questions or data gaps? Reply to this post or reach us through the site.
Daily LA/LB port snapshot for November 9, 2026. Avg berth wait 0 days. Chassis: 9% of line/type combos closed for empty returns. 12.7% of empties dwelling 13+ days. Estimated $198/truck/day system impact. Empty return restrictions, terminal appointment rates, and what to watch today.
Daily LA/LB port snapshot for November 6, 2026. Avg berth wait 0 days. Chassis: 18% of line/type combos closed for empty returns. 16.9% of empties dwelling 13+ days. Estimated $216/truck/day system impact. Empty return restrictions, terminal appointment rates, and what to watch today.
Daily LA/LB port snapshot for November 5, 2026. Avg berth wait 0 days. Chassis: 17% of line/type combos closed for empty returns. 17.9% of empties dwelling 13+ days. Estimated $233/truck/day system impact. Empty return restrictions, terminal appointment rates, and what to watch today.
Daily LA/LB port snapshot for November 4, 2026. Avg berth wait 0 days. Chassis: 15% of line/type combos closed for empty returns. 18.3% of empties dwelling 13+ days. Estimated $240/truck/day system impact. Empty return restrictions, terminal appointment rates, and what to watch today.